

KADA: One Government Dashboard for the Zero Poverty Plan, From Household Census to Waste Trucks
The problem
The Kuppam Area Development Authority is responsible for the region's Zero Poverty by 2029 vision. The work runs through dozens of line departments, each with its own reporting line. Leadership had no consolidated view of KPIs, field data arrived late and unverified, and there was no structured way to run approvals and timelines across departments.
KADA needed a government dashboard for its leadership, fed by data collected in the field rather than reported after the fact.
Department by department
- No consolidated view of KPIs across departments
- Field data that arrived late and unverified
- No structured approvals or timelines
One dashboard, one map
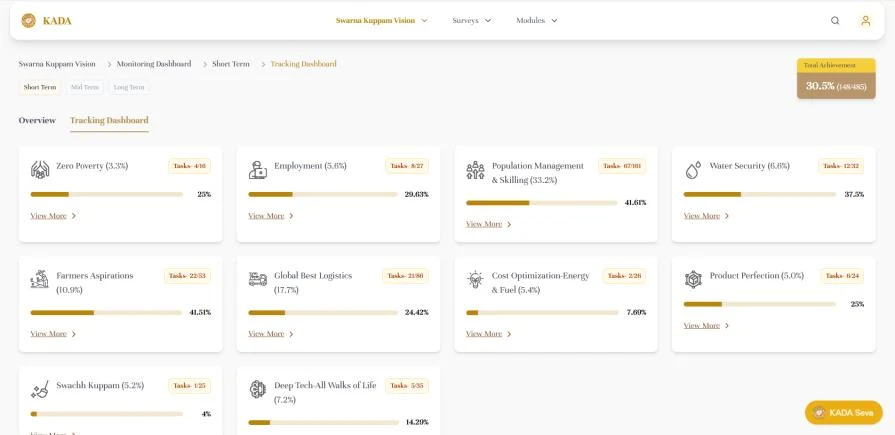
- Leadership dashboards for vision tasks, fleet, projects and investments
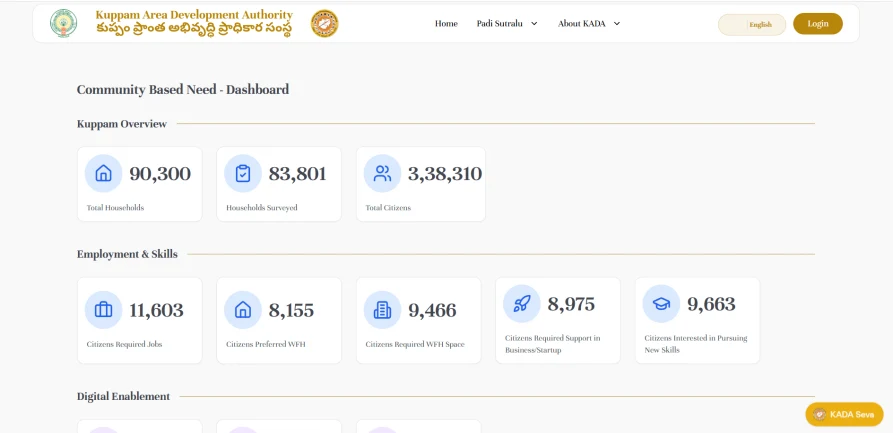
- Household and skills census captured in the field
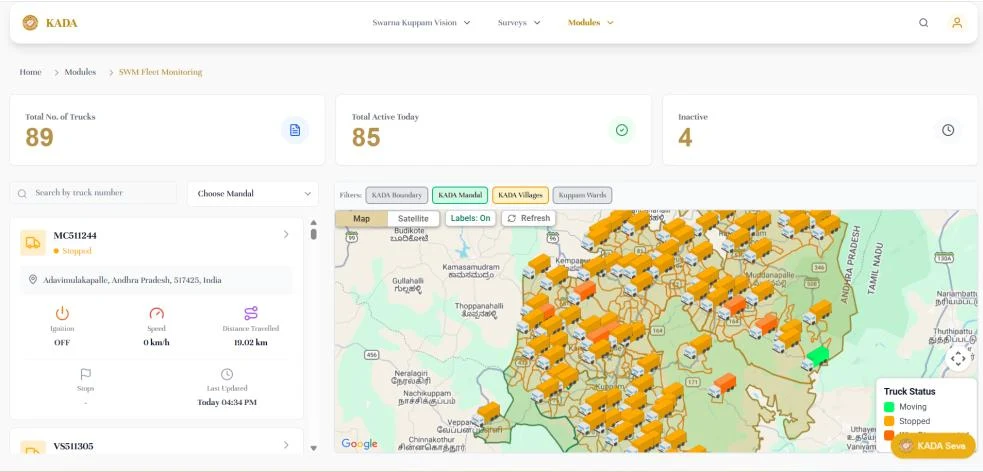
- Geofenced waste trucks with live status
- A chat and voice assistant over the authority's own documents
What we built
Leadership dashboards
Vision tasks, the solid waste fleet, mega projects and investments in one view for the authority's leadership.
Approvals and KPIs
Every initiative tracked with its approvals, timelines, KPIs and performance, across departments.
Field census apps
Mobile apps for the household and skills census and employment profiles, synced to the dashboards.
Geofenced fleet
Location-based monitoring of solid waste vehicles to check route adherence and operations.
Chat and voice assistant
Answers questions about project progress and development figures, using retrieval over the authority's own documents.
Screens
What changed
- Households surveyed in the field, of 90,300
- 83,801
- Waste trucks tracked by geofence
- 89
- Answers from the authority's own documents
- Chat and voice
What we learned
We put every module on the same map of wards and mandals from the start. Census answers, KPIs and truck routes then roll up the same way, so no department's numbers need translating before leadership can compare them.
Want similar results?
Tell us what you are building or running and we will scope the first step.
Prefer to talk?
Book a MeetingMore Case Studies
 Healthcare
FastCare: Wound Measurements That Agree, and Notes Drafted During the Visit
Wound measurements that agree between clinicians and notes drafted during the visit: a wound measurement app that uses the phone's LiDAR, a voice scribe, and an advisor that answers from Gentell FastCare's own wound-care guidance.
 Healthcare
HelloKidney.ai: Clear Answers for Kidney Patients, in Their Own Words
CKD patient education that starts from the patient's own question: the AI conversation platform for HelloKidney.ai, a kidney disease registry, answering in plain language from a curated medical library.